
Data Science Life Cycle: Stages, Real-World Applications, and Career Insights
Introduction: Data Science Life Cycle: The Key to Turning Data into Decisions
Every business today runs on data. From tracking shopping patterns on e-commerce platforms to predicting disease outbreaks, data fuels the world. But raw data is messy, like crude oil, it only becomes valuable once refined.
That’s exactly what the data science life cycle does. It provides a structured roadmap to take raw, scattered data and turn it into measurable business value.
If you’re a student exploring data science careers or a professional planning a shift into this field, understanding the phases of data science life cycle is your foundation. In this blog, we’ll cover the steps of the data science life cycle explained with examples, so you can see how data becomes actionable business insight.
What Is the Data Science Life Cycle?
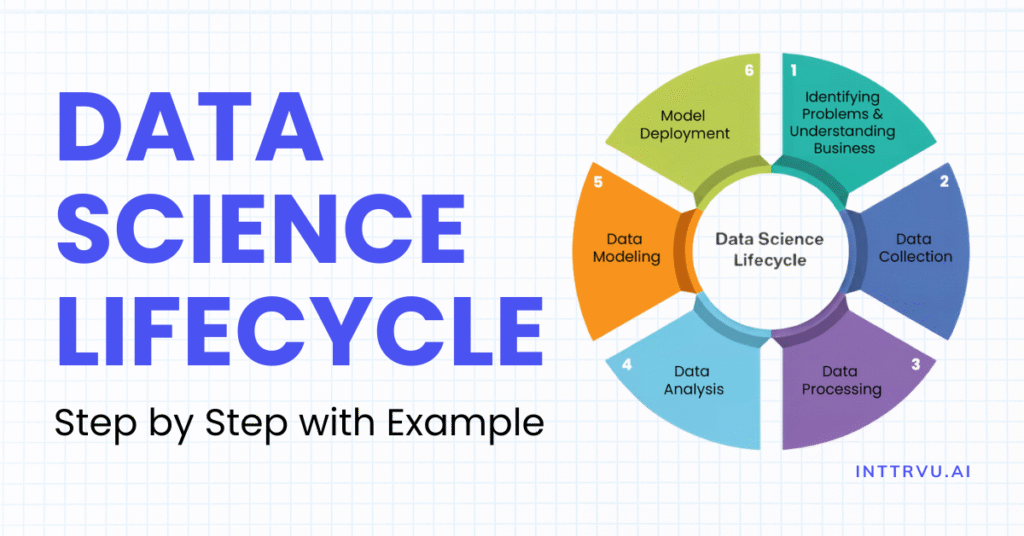
Think of the data science life cycle less as a fixed, rigid diagram and more as a repeatable, living workflow. Each stage connects to the next, and sometimes loops back when new information emerges. It’s not just about fitting an algorithm, it’s about moving from a business problem to a measurable outcome, step by step.
Let’s make this real with an example: A subscription-based app (OTT, telecom, or SaaS) wants to predict customer churn and reduce it by 15% within 90 days.
Here’s how this challenge flows through the data science life cycle, from defining the problem to deploying a solution that keeps customers engaged.
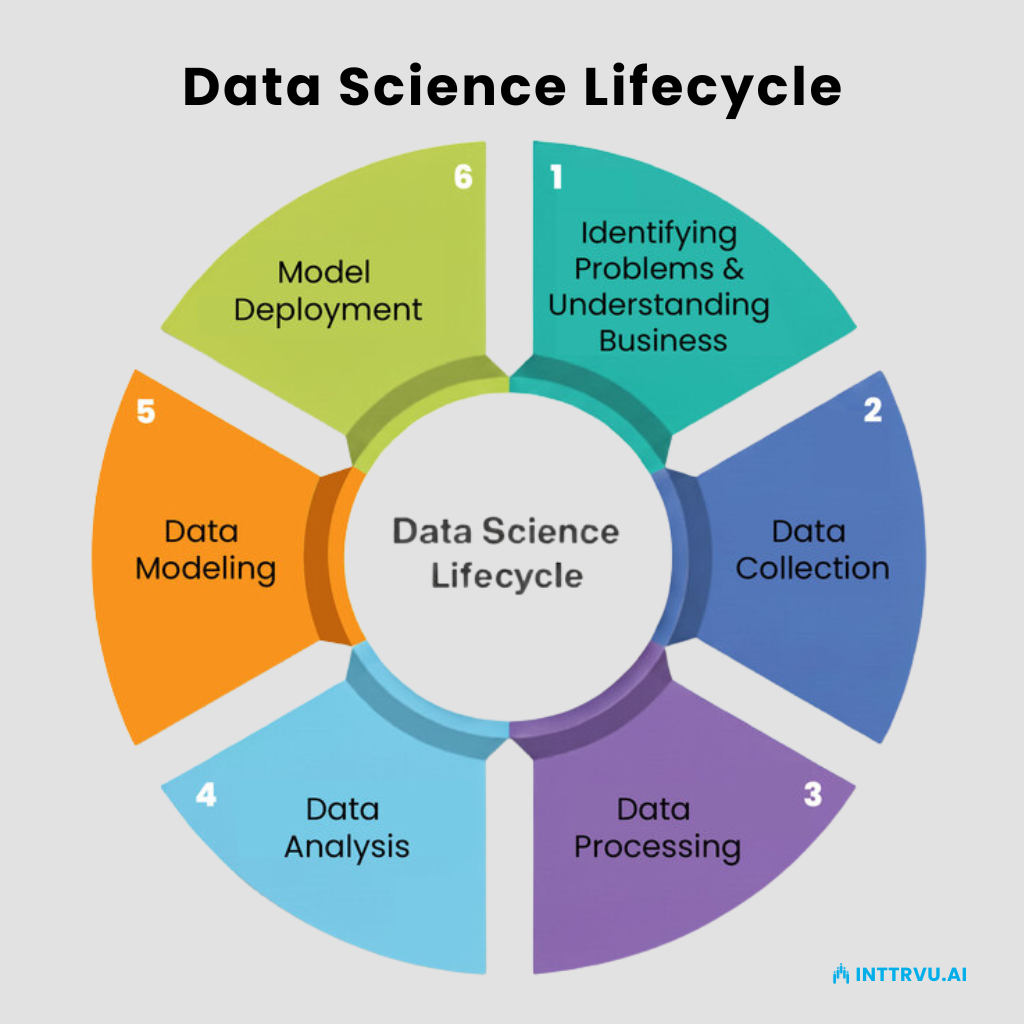
1. Identifying Problems & Understanding Business
Every successful project starts with asking the right questions. This means working closely with business teams to define what problem you’re solving and what success looks like. Without this clarity, even the most advanced model will fail to deliver value.
Stage 1: Problem Definition – Framing the Right Question
This step often decides whether the project succeeds. A broad ambition like “reduce churn” becomes a clear, measurable objective.
Example:
Define churn → users inactive for 60 days
Target outcome → reduce monthly churn from 4.5% → 3.8% within 90 days
Plan actions → discounts, proactive support, personalized nudges
Clarity at this stage prevents building models that look impressive but solve the wrong problem.
2. Data Collection
Once the problem is clear, relevant data must be identified and gathered. This could come from internal sources (databases, logs, CRMs) or external sources (APIs, public datasets). The goal is to have the right quantity and quality of data needed to solve the problem.
Stage 2: Data Discovery – Finding What Exists
At this point, teams scout for available data and align definitions across departments (e.g., marketing’s “active user” vs. product logs).
Example:
For churn prediction, teams gather:
Login and session events
Payment history
Support ticket logs
Campaign engagement data
The focus is not on collecting everything but on finding complete, trustworthy data.
3. Data Processing
Raw data is rarely ready for analysis. Processing includes cleaning, handling missing values, removing duplicates, standardizing formats, and making the data consistent. This step ensures that what goes into the model is accurate and reliable.
Stage 3 & 4: Data Ingestion, Cleaning & Preprocessing
Data from different sources is brought into one place. This can be done using SQL pipelines or tools like Airflow, dbt, or Spark. The aim is to create clean, structured tables that are ready for analysis.
Example:
For our churn case, the team builds a rolling 30-day behavior table per user, enriched with plan type, device, and campaign history. They also exclude post-churn events and log-transform extreme usage spikes.
4. Data Analysis
Exploratory Data Analysis (EDA) helps uncover patterns, relationships, and potential drivers of outcomes. Visualization, descriptive statistics, and hypothesis testing are key here.
Stage 5: EDA & Hypothesis Building
This is where data starts telling its story. Instead of just plotting charts, teams ask deeper questions:
Example:
Users with 2+ failed payments are 3× likelier to churn
Users exploring diverse content in week one retain 15% longer
These insights often drive quick wins even before a model is built.
5. Data Modeling
Once the data is prepared, machine learning or statistical models are built to predict outcomes, classify data, or find patterns.
Stage 6 & 7: Feature Engineering + Model Training
Hypotheses are converted into features such as recency, frequency, and behavioral diversity scores. Models are then trained, starting simple (logistic regression) and evolving to advanced techniques like XGBoost or LightGBM.
Example:
Strong churn signals: days since last session, billing failures in last 60 days, drop in weekly minutes
Temporal splits ensure training uses past data and validates on future periods
6. Model Deployment
A model is only valuable if its predictions are used in real-world decision-making. Deployment puts the model into production, via APIs, dashboards, or batch pipelines, so its predictions can be acted upon.
Stage 8: Validation, Fairness & Robustness
Before a model goes live, it must be tested thoroughly. This stage checks:
Performance Metrics: Accuracy, precision, recall, F1 score, and ROC-AUC.
Calibration: Ensures the predicted probabilities match real-world outcomes.
Fairness: Confirms that the model performs equally well across different user groups (e.g., regions, plan types).
Robustness: Tests how the model behaves with future or unseen data to avoid performance drop.
Example:
The churn model is validated on past months’ data to see if it correctly predicts who churned. The team compares results across segments, like new vs. old customers, to ensure no group is unfairly flagged.
Stage 9: Decision Design – Turning Predictions into Action
A model is only useful if it drives action. At this stage, data scientists collaborate with business teams to develop a clear playbook for utilizing predictions.
Example:
High-risk & high-value users: Assigned to retention team for personal follow-up.
Medium-risk users: Receive in-app recommendations or nudges.
Billing failures: Trigger automated payment reminders or support calls.
This ensures everyone knows what to do with the model’s predictions and how success will be measured.
Stage 10: Model Deployment
Deployment is about making predictions available to the right systems and teams. Different strategies are depending on the use case:
Batch Scoring: Predictions are generated daily or weekly and stored in a table. Useful for churn campaigns or email targeting.
Real-Time APIs: Predictions are made instantly when a user takes an action. Ideal for fraud detection or dynamic personalization.
In-Database Models: Some platforms (like BigQuery ML or Snowflake ML) allow running models directly inside the data warehouse.
Example:
For the churn project, a nightly job updates the churn-risk list, and the CRM team uses it to target users with personalized retention campaigns.
Post-Deployment: Monitoring & Governance
Deploying a model is not the finish line, it’s the start of continuous improvement. Once a model goes live, it interacts with real-world data that changes over time. This is where model monitoring and governance become critical.
Model Monitoring:
Teams track key performance metrics such as accuracy, precision, recall, or business KPIs (like churn reduction). They also watch for model drift, where the data or customer behavior changes in a way that reduces model performance.Fairness & Compliance:
Regular audits ensure that the model is unbiased and does not negatively impact specific user groups. Governance processes include documenting assumptions, data sources, and retraining schedules for transparency.
Example:
Imagine that pricing changes cause a sudden increase in customer churn. The team notices this via monitoring dashboards, retrains the model with the latest data, and redeploys it to maintain predictive accuracy. Alongside, they maintain data dictionaries, document all features used, and create compliance reports, ensuring that the process is auditable and meets regulatory standards.
Real-World Outcome
Let’s revisit our subscription app scenario. After following the entire data science life cycle, the team uncovers the top churn drivers:
Billing failures
Drop in weekly engagement
Frustration caused by a confusing paywall
Using these insights, they deploy a LightGBM model that predicts which users are most likely to churn in the next 30 days. The business team then designs targeted interventions:
Billing Support: Proactive reminders and seamless retry options for failed payments
Personalized Nudges: Recommendations and offers to re-engage less active users
Special Offers: Limited-time discounts for price-sensitive segments
Result: These actions deliver a measurable impact, high-risk users show a 9–12% improvement in retention, translating directly into higher revenue and reduced churn.
Conclusion
The data science life cycle is more than just a framework, it’s the backbone of every data-driven solution in today’s world. From defining the right problem to deploying and monitoring models, each stage ensures that businesses don’t just collect data but transform it into actionable insights and tangible impact.
For professionals, understanding the life cycle of data science provides clarity on how projects evolve in real companies. It helps you connect the dots between technical skills, business outcomes, and cross-functional teamwork. Whether you’re predicting customer churn, building recommendation systems, or detecting fraud, the life cycle ensures structure, reliability, and success.
If you’re planning a transition into data science, mastering this life cycle is essential.
At INTTRVU.AI, our NASSCOM-certified Data Science & AI Program and Interview Preparation Training equip you not just with theory but also with hands-on experience through real-world projects and case studies. With mentorship and career support, we prepare you to confidently step into your next data-driven role.
The future belongs to those who can turn data into decisions. The question is: are you ready to be one of them?
FAQs
The data science life cycle is a step-by-step process that transforms raw data into useful insights. It includes stages like defining the problem, collecting and cleaning data, analyzing patterns, building models, deploying them, and monitoring results.
The life cycle of data science ensures that projects are structured, reliable, and aligned with business goals. Without it, companies risk wasting resources on models that don’t solve real problems or deliver measurable impact.
Anyone aiming for a data-driven career should learn it. This includes working professionals transitioning into roles like Data Scientist, Data Engineer, or Business Analyst, as well as students preparing for their first data science job. Mastering the data science life cycle builds both technical confidence and strategic thinking.

Building Data Science Team Strategy
Master the 7-step formula to create a data science team that influences decisions, drives revenue, and delivers measurable business impact.

Master Data Science While Working | Best Data Science Course
Master data science without quitting your job. Discover practical strategies, real-world projects, and expert tips to balance work and learning. Explore the best data science classes and find the right data science course to grow your career in data science.