Machine Learning Algorithms Every Data Scientist Should Know in 2025
(Expanded with In-Depth Explanation, Projects, and Interview Tips)
What Are Machine Learning Algorithms?
A machine learning algorithm is a mathematical model or method that enables computers to learn from and make predictions on data. These algorithms power real-world systems like fraud detection, recommendation engines, forecasting tools, and AI assistants.
But which algorithms matter the most for aspiring data scientists in 2025?
Let’s dive into them one by one.
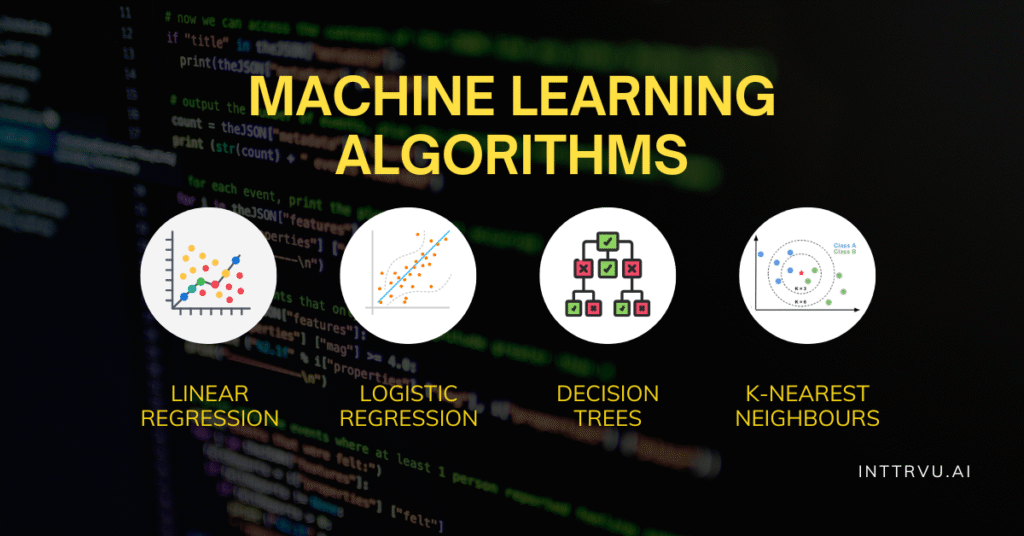
1. Linear Regression
Definition
Linear Regression is a supervised learning algorithm that models the relationship between a dependent variable and one or more independent variables using a straight line. It’s one of the most fundamental and interpretable ML algorithms.
How It Works
It tries to find the best-fitting linear equation (y = mx + c) that minimizes the error (usually Mean Squared Error) between predicted and actual values using techniques like Ordinary Least Squares.
Project Example: House Price Prediction
- Dataset: Includes features like square footage, number of bedrooms, and location.
- Approach: Train the model using LinearRegression() from sklearn.linear_model, predict prices for unseen houses, evaluate with R² score and RMSE.
- Application: Used by real estate portals and banks for property valuation.
When to Use
- When the relationship between input and output is roughly linear.
- When interpretability is a priority (e.g., understanding impact of individual features).
When Not to Use
- When data has complex non-linear relationships.
- When multicollinearity exists between features or there’s significant outlier influence.
Implementation Tip
Use statsmodels for a regression summary with coefficients and p-values, ideal for feature selection.
Interview Tip
Be ready to explain assumptions: linearity, homoscedasticity, independence, no multicollinearity, and normal distribution of errors.
2. Logistic Regression
Definition
Logistic Regression is a classification algorithm that estimates probabilities using the sigmoid function and classifies inputs based on a threshold (commonly 0.5).
How It Works
It applies the logistic (sigmoid) function to a linear combination of input features, mapping the output to a probability between 0 and 1. It optimizes the log loss (cross-entropy) during training.
Project Example: Email Spam Detection
- Dataset: Word frequency, sender metadata, email length.
- Approach: Use LogisticRegression() from sklearn.linear_model to classify emails as spam or not.
- Application: Used in email clients and filtering services.
When to Use
- For binary or multi-class classification with linear boundaries.
- When the model needs to be fast, interpretable, and scalable.
When Not to Use
- When data has complex patterns better suited for tree-based or neural methods.
- When you need non-linear decision boundaries (unless using feature engineering).
Implementation Tip
Normalize inputs and check for class imbalance. Use class_weight=’balanced’ if necessary.
Interview Tip
Know the difference between logistic regression and linear regression, especially the cost function and output interpretation.
3. Decision Trees
Definition
A Decision Tree splits data recursively based on feature values to form a tree-like structure, where each internal node represents a condition and each leaf node represents a prediction.
How It Works
The tree selects features that best split the data using metrics like Gini Impurity or Information Gain (Entropy). It continues splitting until a stopping criterion is met (max depth, minimum samples, or pure leaves).
Project Example: Loan Approval Classification
- Dataset: Applicant income, credit history, loan amount.
- Approach: Use DecisionTreeClassifier() from sklearn.tree to train a binary classifier.
- Application: Financial institutions use it for eligibility models due to its interpretability.
When to Use
- When interpretability and rule-based decisions are required.
- On tabular data with mixed data types (numerical + categorical).
When Not to Use
- For problems requiring high accuracy where overfitting is a concern.
- When data is too noisy or not properly preprocessed.
Implementation Tip
Prune the tree (set max_depth, min_samples_split) to prevent overfitting.
Interview Tip
Be able to manually build a tree from a small dataset and explain impurity measures.
4. Random Forest
Definition
Random Forest is an ensemble algorithm that builds multiple decision trees on bootstrapped data samples and combines their predictions to improve accuracy and reduce overfitting.
How It Works
Each tree is trained on a random subset of data and features. Final prediction is based on majority voting (classification) or averaging (regression). The randomness and ensemble reduce variance.
Project Example: Employee Attrition Prediction
- Dataset: Job satisfaction, salary, years at company.
- Approach: Use RandomForestClassifier() from sklearn.ensemble to predict likelihood of leaving.
- Application: HR departments use it to identify flight-risk employees.
When to Use
- For structured data problems where accuracy is more important than interpretability.
- When data has a lot of features and potential non-linear relationships.
When Not to Use
- In real-time applications with latency constraints due to slower inference.
- When model size needs to be minimal (e.g., embedded systems).
Implementation Tip
Use feature_importances_ for feature selection or interpretation.
Interview Tip
Explain how bagging and randomness help reduce overfitting compared to a single decision tree.
5. XGBoost (Extreme Gradient Boosting)
Definition
XGBoost is a powerful gradient boosting framework designed for performance and scalability. It builds sequential decision trees, where each new tree attempts to correct the errors of the previous ones.
How It Works
XGBoost uses gradient descent to minimize a regularized objective function combining the model’s training loss and complexity. It employs shrinkage (learning rate), column subsampling, and regularization (L1/L2) to reduce overfitting.
Project Example: Customer Churn Prediction
- Dataset: Customer demographics, tenure, payment history, service usage.
- Approach: Use xgboost.XGBClassifier() to model churn probabilities. Perform hyperparameter tuning with GridSearchCV.
- Application: Telecom and SaaS companies use this to proactively retain customers.
When to Use
- For tabular data where performance matters.
- In high-stakes classification/regression problems (e.g., fraud detection, credit scoring).
When Not to Use
- On very small datasets, where simpler models are sufficient.
- When interpretability is more important than performance.
Implementation Tip
Use early stopping and monitor validation error to prevent overfitting. Always scale inputs and use max_depth, eta, and subsample wisely.
Interview Tip
Be prepared to explain boosting vs bagging, and how XGBoost handles missing values natively.
6. LightGBM
Definition
LightGBM is another gradient boosting framework optimized for speed and efficiency. It uses histogram-based algorithms and grows trees leaf-wise instead of level-wise, leading to faster and often more accurate models.
How It Works
LightGBM creates decision trees using gradient-based one-side sampling (GOSS) and exclusive feature bundling (EFB), which drastically reduce memory usage and training time.
Project Example: Click-Through Rate (CTR) Prediction for Ads
- Dataset: Ad content, user profile, time of day, previous clicks.
- Approach: Use lightgbm.LGBMClassifier() with large-scale ad impression data.
- Application: Ad tech platforms use it to optimize bidding and placement strategies.
When to Use
- When working with very large datasets or features.
- In environments requiring fast training and deployment (e.g., online systems).
When Not to Use
- On extremely small datasets, where it may overfit due to complex splits.
- In problems where interpretability is required out-of-the-box.
Implementation Tip
Convert categorical features into integers and pass them as categorical_feature to LightGBM for automatic handling.
Interview Tip
Explain leaf-wise growth strategy and how LightGBM differs from XGBoost in both tree construction and speed.
7. K-Nearest Neighbours (KNN)
Definition
KNN is a non-parametric, instance-based learning algorithm that classifies new points by finding the ‘k’ closest points in the training set and assigning the majority class.
How It Works
It calculates the distance (Euclidean, Manhattan, etc.) between the input sample and all training samples. The majority label among the k nearest neighbors is chosen as the prediction.
Project Example: Handwritten Digit Classification (MNIST)
- Dataset: Pixel values of 28×28 grayscale images.
- Approach: Use KNeighborsClassifier() from sklearn.neighbors, tune k via cross-validation.
- Application: Optical character recognition (OCR) tools and mail sorting systems.
When to Use
- When you need a simple, lazy learning algorithm for small datasets.
- When the decision boundary is non-linear but well-separated.
When Not to Use
- On large datasets or in real-time applications due to slow prediction times.
- When data is high-dimensional, distance metrics become unreliable.
Implementation Tip
Use dimensionality reduction (like PCA) before applying KNN to improve performance.
Interview Tip
Be prepared to discuss the curse of dimensionality and the role of distance metrics.
8. Support Vector Machines (SVM)
Definition
SVM is a powerful classification algorithm that finds the optimal hyperplane which maximizes the margin between different classes. It’s effective in high-dimensional spaces.
How It Works
SVM constructs a decision boundary (hyperplane) using support vectors (critical points closest to the margin). It can also use kernel tricks to handle non-linear classification (e.g., RBF, polynomial).
Project Example: Fake News Detection
- Dataset: News headlines, article content, source reliability.
- Approach: Use TF-IDF vectors as input to SVC() with the RBF kernel. Classify as fake or real.
- Application: Social media and news platforms use this to detect misinformation.
When to Use
- In binary classification problems with a clear margin of separation.
- For text classification or problems with high-dimensional data.
When Not to Use
- On very large datasets, it can be computationally expensive.
- When output probabilities are needed (unless using probability=True).
Implementation Tip
Scale the features before training, as SVMs are sensitive to feature magnitudes.
Interview Tip
Know how to explain the kernel trick and why SVMs don’t work well on noisy datasets.
How INTTRVU Can Help:
Understanding these algorithms is essential, but applying them in interviews and real-world projects is where many professionals struggle. At INTTRVU, we help you:
- Master ML algorithms through hands-on certification programs
- Prepare for top roles with 1:1 mock interviews and CV reviews
- Get career guidance from senior data scientists and hiring managers
Whether you’re switching domains or starting fresh, we ensure you’re ready for the real world.
FAQs
They are used in finance, healthcare, e-commerce, and tech to automate predictions, detect fraud, personalize experiences, and more.
Start with Linear and Logistic Regression to build foundational knowledge before moving to tree-based and ensemble methods.
It depends on your data type, size, target variable (classification/regression), and need for interpretability vs performance.

Building Data Science Team Strategy
Master the 7-step formula to create a data science team that influences decisions, drives revenue, and delivers measurable business impact.

Master Data Science While Working | Best Data Science Course
Master data science without quitting your job. Discover practical strategies, real-world projects, and expert tips to balance work and learning. Explore the best data science classes and find the right data science course to grow your career in data science.

Enter the Data Science Field with No Prior Experience
Thinking about a career switch? This blog explains how to transition into data science step by step. Explore a beginner-friendly data science course and a practical data science course syllabus that covers Python, SQL, machine learning, and portfolio-building to help you land your first role.

Data Science Lifecycle: Stages, Real-World Applications, and Career Insights
Explore the complete data science life cycle in detail with real-world case studies. Understand each stage of the data science life cycle, who’s involved, and why mastering the data science life cycle is essential for building a successful data science career with INTTRVU.AI.

10 Simple Python Projects with Code
Learn 10 simple python projects with detailed code explanations. Build your portfolio with python projects and start your Data Science career with confidence.

Top Python Libraries to Learn for Data Science and AI Careers
Discover the most important python libraries for data science, machine learning, and AI in 2025. Learn how python libraries work, see real python library code examples.


